Tag: Data Visualization

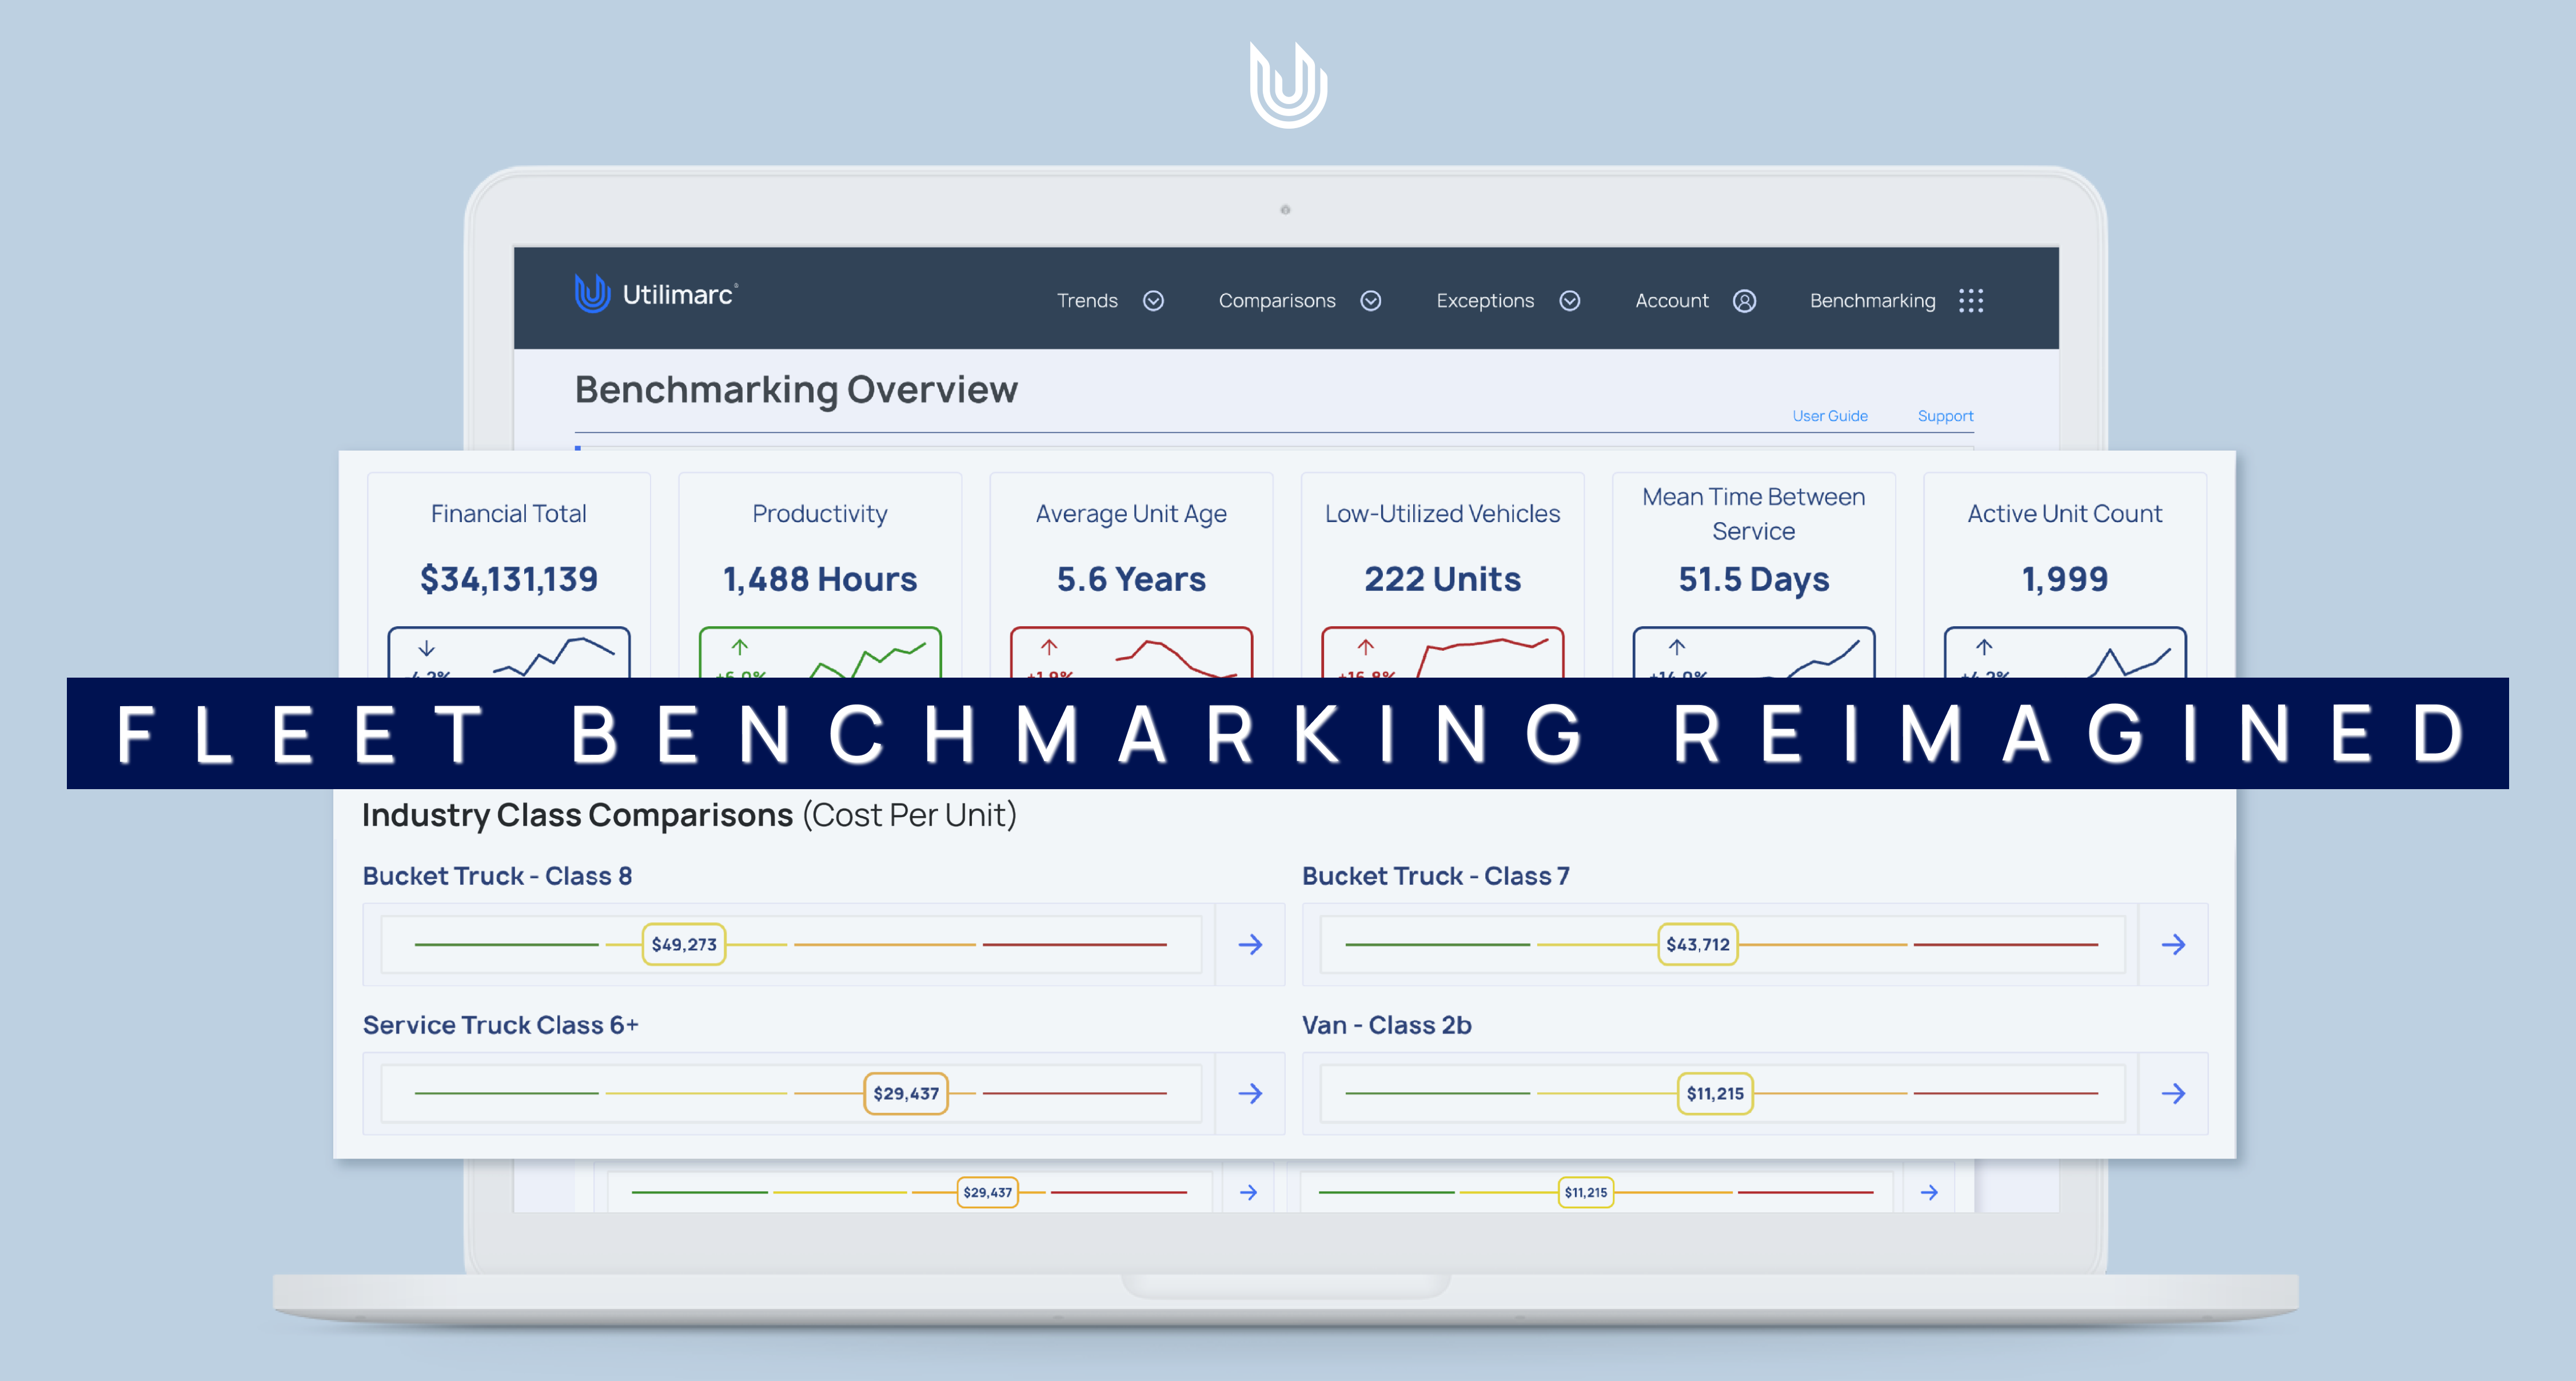
The new benchmarking application features improvements for a more dynamic customer experience and deeper understanding of fleet data. With an expanded report set, increased visualizations and filter capabilities and macro-level Benchmark Study trends, the redesign delivers an in-depth data reporting experience on an intuitive and interactive platform.

Understanding your data is a crucial aspect to fleet management. It’s true when you’re growing your fleet, looking to expand, fine-tune your operations and nearly every facet of the management process. Fleet managers know that as their fleets get larger, the data they have grows exponentially – both in quantity and importance. But where does that leave them?

A dashboard connects all of your data streams and sources but spares you the headache of connecting each source of data yourself.

This week, we’re talking about how data application can affect your fleet management strategy. It’s more than just securing your data and looking at dashboards. Data application is not just one facet of your fleet management strategy, it’s all encompassing.